The Short Answer
“The app feels slow” is a useful report, but it is not yet a diagnosis.
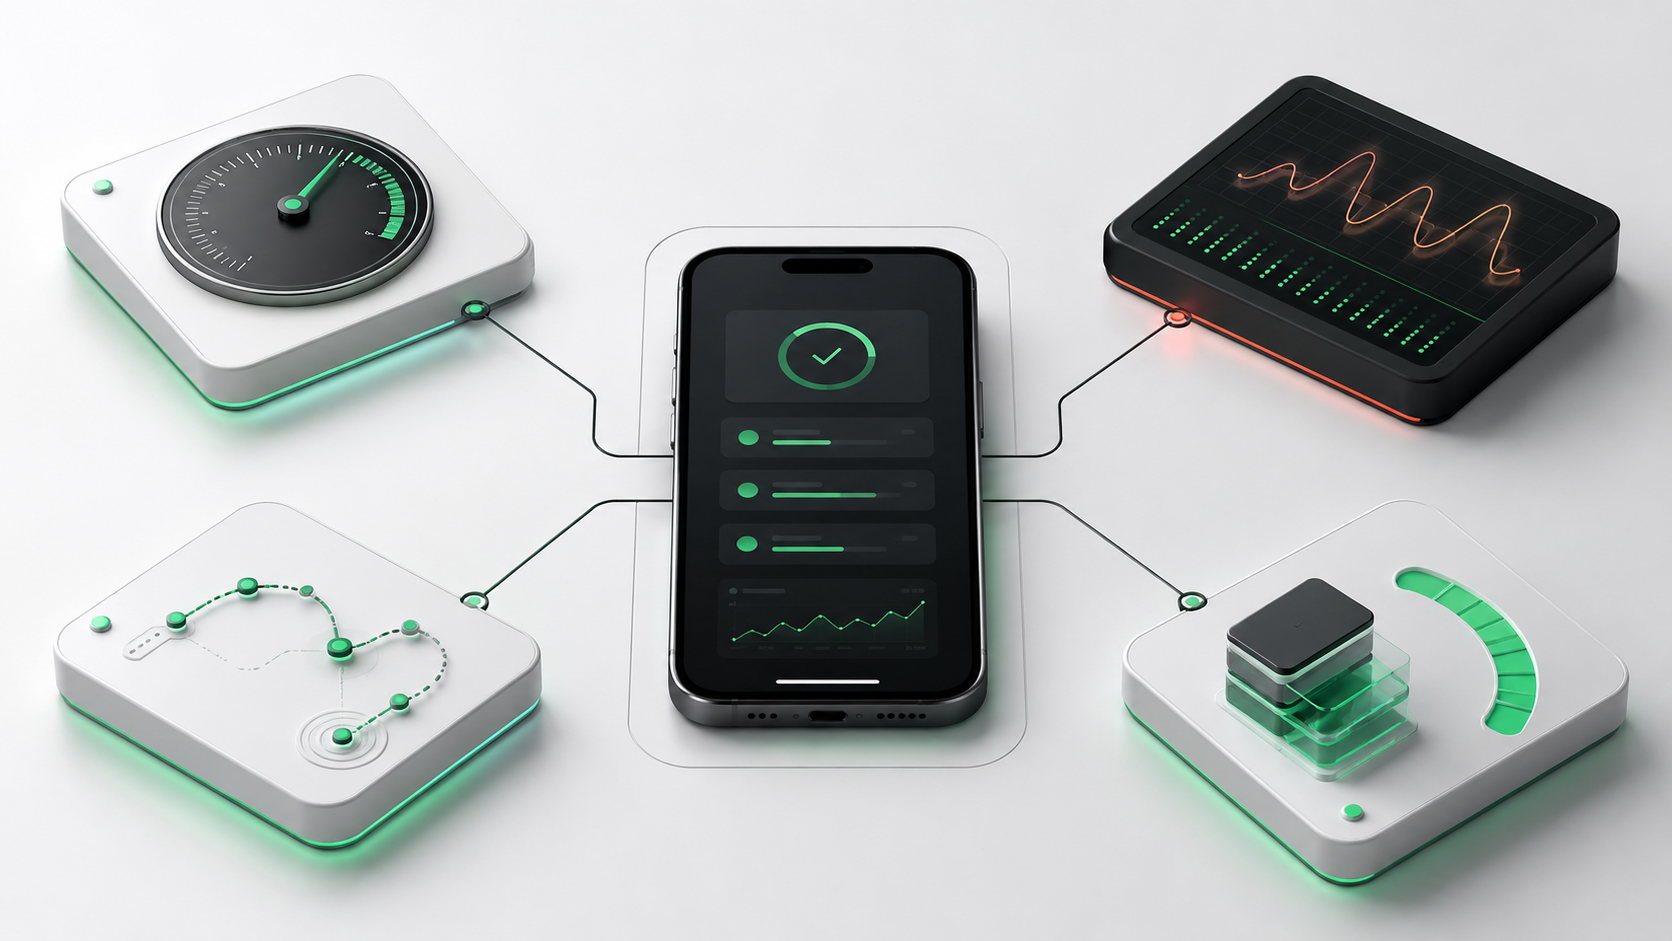
Mobile performance can fail in several different ways:
- The app takes too long to show its first useful screen.
- Scrolling stutters or animations hitch.
- Taps appear to do nothing.
- Screens wait for network responses.
- Images consume too much memory or data.
- Background work drains battery.
- The app crashes, freezes or is removed from memory.
- The interface technically responds but still feels uncertain or delayed.
A useful mobile app performance audit separates these symptoms before anyone starts optimising.
| Performance area | What to measure | Typical evidence |
|---|
| Startup | Time from launch to first useful interaction | Cold-start and returning-start recordings |
| Rendering | Frame timing, jank, layout and paint work | Profile traces and slow-scroll observations |
| Interaction | Delay between user input and visible response | Taps, typing, navigation and gesture tests |
| Network | Request duration, payload size, retries and failures | Network traces across realistic connections |
| Memory | App memory use, image memory and growth over time | Device profiling and long-session testing |
| Battery | Background work, location, sensors and wake activity | Energy or battery profiling |
| Stability | Crashes, hangs, ANRs and failed journeys | Store dashboards, crash reports and test evidence |
| Perceived performance | Whether users know what is happening | Usability observation and support feedback |
The aim is not to make every metric as small as possible. The aim is to find the performance problems that interfere with the product’s most important user journeys.
Why “Slow” Is Not a Diagnosis
Two users can describe completely different problems with the same word.
One person may be waiting for the application to start. Another may be looking at a screen that loaded quickly but contains an expensive list. A third may be on a weak connection and waiting for a large image. Someone else may be tapping a button repeatedly because the interface has not acknowledged the first tap.
These need different investigations.
The Flutter performance profiling guidance separates concerns such as UI work, GPU work, frame timing and jank. The Flutter DevTools Performance view can help teams inspect frames and timeline events. This is more useful than guessing from a single device or a debug build.
Apple also recommends a continuous performance cycle: gather information, measure behaviour, make one change and observe the result. Its documentation covers launch time, responsiveness, memory, energy, disk and network-related measurements in Performance and metrics.
The first principle is simple:
Measure the user journey and the system behaviour separately, then connect them.
Define the Audit Before Running It
A performance audit becomes difficult to interpret when every device, connection and journey is different.
Write down the test conditions first.
| Audit input | Decision to make |
|---|
| Target devices | Which current, older and lower-capability devices represent the real audience? |
| Operating systems | Which iOS and Android versions need coverage? |
| Build type | Will the test use a profile or release-like build rather than debug mode? |
| Network conditions | Which realistic Wi-Fi, mobile and unreliable conditions matter? |
| User journeys | Which three to five journeys matter most to the product? |
| Test data | Will the dataset represent realistic list sizes, images and account states? |
| Starting state | Will each test begin from a cold start, a returning session or a populated cache? |
| Evidence format | Where will timings, traces, recordings and observations be stored? |
| Acceptance rule | What level of performance is acceptable for each important journey? |
Flutter’s documentation specifically recommends using a profile build when analysing performance because debug-mode timings are not representative of release performance. See Use the Performance view.
Do not compare results from different conditions as though they were one measurement. A cold start on a lower-capability device over an unreliable connection answers a different question from a warm start on a recent device with cached content.
Audit Startup and First Use
Startup is the first performance experience. If the product takes too long to show useful content, users may assume it has failed before they reach the main journey.
Separate startup into stages:
- Application process begins.
- First visible frame appears.
- Initial content becomes meaningful.
- The primary screen becomes interactive.
- Network-dependent content finishes or reaches a useful state.
Android documentation distinguishes cold, warm and hot starts, and discusses time to initial display and time to full display in its App startup time guidance.
Use a table like this during the audit:
| Startup check | Question | Evidence |
|---|
| Cold start | How long before the first useful screen appears after the app was not running? | Repeated launch recordings and timing notes |
| Returning start | Does the app restore a previous session without unnecessary work? | Background-to-foreground observation |
| Authentication | Is account restoration blocking the first usable state? | Trace and network timing |
| Configuration | Are remote settings, feature flags or services initialised too early? | Startup timeline |
| First data load | Does the first screen wait for more data than necessary? | Network trace and visible state |
| Failure state | What does the user see when startup data cannot be retrieved? | Offline or failed-request test |
| First interaction | When can the user complete a meaningful action? | Tap and typing test |
A branded splash screen is not the same as a useful first state. The audit should record when the person can understand and use the product, not just when a coloured screen appears.
Rendering problems often appear only during movement or repeated interaction.
Test:
- Long lists
- Image-heavy feeds
- Forms with validation
- Animated transitions
- Expanding and collapsing content
- Charts or maps
- Keyboard appearance
- Pull-to-refresh
- Navigation between populated screens
- Rapid repeated taps
- Rotation or window-size changes where relevant
The Flutter performance best-practices guidance covers expensive operations, build cost, layout passes, lists, clipping, opacity and frame budgets.
| Symptom | Measurement or investigation | Possible area to inspect |
|---|
| Scrolling stutters | Frame timeline and slow-scroll recording | List construction, image decoding, layout or paint work |
| Tap feels ignored | Input-to-feedback timing | Main-thread work, disabled state or missing progress feedback |
| Transition hitches | Timeline during navigation or animation | Large builds, shaders, effects or synchronous work |
| Typing lags | Keystroke-to-render response | Validation, filtering, rebuild scope or expensive formatting |
| List worsens over time | Repeated scroll and memory observation | Unbounded data, image retention or repeated rebuilds |
| Only one screen fails | Screen-specific trace | Widget tree, data volume, custom painting or third-party component |
Flutter describes a frame as janky when it takes longer than the available frame budget for the device refresh rate. Treat that as a diagnostic signal, not as the only definition of a good experience.
A technically smooth screen can still feel poor if it lacks feedback. Record both the trace and the user-visible behaviour.
Audit Network, Caching and Images
A network problem can look like a rendering problem. A screen may appear frozen because it is waiting for an API, while a different screen may be slow because it is decoding large images.
Inspect:
- Request start and completion time
- Number of requests during each journey
- Duplicate requests
- Payload sizes
- Response errors and retries
- Timeout behaviour
- Cache hits and misses
- Pagination and prefetching
- Image dimensions and formats
- Behaviour when the connection is interrupted
- Whether stale but useful content can be shown
| Network or content check | What good evidence looks like |
|---|
| Initial data | The first useful state does not wait for unrelated content |
| Large responses | Payload size is understood and connected to the user journey |
| Images | Images are sized for their display context and loaded progressively where appropriate |
| Caching | The team knows what is cached, for how long and when it becomes invalid |
| Retry | A failed request produces a clear, controlled recovery path |
| Offline state | The user can distinguish unavailable data from an empty result |
| Pagination | The product does not load more content than the journey requires |
| Observability | Request failures can be linked to a product journey without exposing sensitive data |
Do not improve performance by hiding a failure. A skeleton screen that never resolves is not a performance solution. Make the state honest and measurable.
Audit Memory, Battery and Stability
Performance work should include resource use over time, not just the first screen.
Run longer sessions that include:
- Repeated navigation
- Opening and closing image-heavy screens
- Backgrounding and returning to the app
- Uploads or downloads
- Location, camera, Bluetooth or sensor use where relevant
- Push notification handling
- Offline and retry behaviour
- Account switching or sign-out
- Large data sets
Android vitals includes stability, performance, battery and memory signals, including user-perceived crashes, ANRs, memory and bitmap memory. See Android vitals.
Apple’s Improving your app’s performance guidance also covers launch time, memory use, energy use, disk writes, hangs and responsiveness.
| Resource area | Audit question |
|---|
| Memory | Does memory rise continuously during a normal session? |
| Images | Are bitmap dimensions and retention appropriate? |
| Background work | What continues after the user leaves the screen? |
| Battery | Are location, sensors, network or timers active only when needed? |
| Stability | Do crashes, freezes or ANRs cluster around a particular journey? |
| Recovery | Does the app recover after interruption, backgrounding or poor connectivity? |
| Storage | Is local data managed deliberately, including removable cache content? |
The correct optimisation depends on the product. Background audio, navigation and messaging have different legitimate resource patterns. Measure against expected use, not an abstract target.
Prioritise Findings Before Optimising
A performance audit can produce more findings than a team can fix immediately. Prioritise them using user impact and evidence.
| Priority | User impact | Evidence strength | Recommended action |
|---|
| High | Blocks or seriously disrupts a core journey | Reproduced in a realistic condition | Assign an owner and investigate immediately |
| Medium | Creates friction but has a workable alternative | Reproduced or supported by multiple signals | Schedule targeted profiling and a measured change |
| Low | Noticeable but not important to the current journey | Weak, isolated or cosmetic evidence | Record and revisit after higher-value work |
| Unknown | Reported but not yet reproducible | Insufficient evidence | Improve logging, test conditions or reproduction steps |
Each finding should contain:
- The affected journey
- Device and operating-system context
- Network condition
- Build type
- Reproduction steps
- User-visible symptom
- Measurement or trace
- Suspected cause
- Proposed change
- Success measure
- Retest condition
Avoid tickets that only say “optimise this screen”. They create activity without a clear definition of improvement.
Retest After Every Meaningful Change
A performance fix is incomplete until the original condition is tested again.
Use this retest sequence:
- Reproduce the original problem.
- Capture the baseline.
- Make one meaningful change where possible.
- Run the same journey and conditions.
- Compare user-visible behaviour and measurements.
- Test a nearby journey for regression.
- Record the decision and remaining uncertainty.
Flutter provides an official recipe for recording performance timelines during integration tests in Measure performance with an integration test. Repeatable tests are especially useful for scrolling, navigation and other journeys that are difficult to compare by memory.
Do not assume a lower number is automatically better. A change that improves startup but makes the first screen less informative may not improve the product. A change that reduces network requests but removes useful offline behaviour may create a different problem.
The First Three Measurements
Start with the measurements that connect most directly to user experience:
- Time to first useful interaction: when can the user understand and perform the next meaningful action?
- Interaction and rendering responsiveness: where do taps, typing, scrolling or navigation feel delayed?
- Journey reliability under realistic conditions: what happens on representative devices, data sets and networks?
These measurements create a practical starting point. Add memory, battery, image, network and stability investigation when the journey or evidence indicates that they matter.
Conclusion
A mobile app performance audit should reduce guesswork.
Define the devices, networks, builds and journeys. Separate startup, rendering, interaction, network, memory, battery and stability. Capture evidence before changing code. Prioritise by user impact, then retest the original journey after each meaningful improvement.
For help with mobile engineering, performance investigation or product delivery, explore FlutterCraft services. More practical guidance is available on the FlutterCraft blog.
Sources


 Moeen AhmadLead Software Engineer27 Aug 202610 min read71